Genome size estimation of 43 Korean Carex
Article information

Abstract
The genome size is defined as the amount of DNA in an unreplicated gametic chromosome complement and is expressed as the 1C value. It is a fundamental parameter of organisms that is useful for studies of the genome, as well as biodiversity and conservation. The genome sizes of Korean plants, including Carex (Cyperaceae), have been poorly reported. In this study, we report the genome sizes of 43 species and infraspecific taxa of Korean Carex using flow cytometry, and these results represent about 24.4% of the Carex species and infraspecific taxa distributed on the Korean peninsula. The Plant DNA C-Value Database (release 7.1) updated with and now including our data (a total of 372 Carex accessions) shows that the average genome size of members of the Carex species is 0.47 pg (1C), and the largest genome (C. cuspidate Bertol.; 1C = 1.64 pg) is 8.2 times larger than the smallest (C. brownii Tuck., C. kobomugi Ohwi, C. nubigena D. Don ex Tilloch & Taylor, and C. paxii Kük.; 1C = 0.20 pg). The large genomes are frequently found in the subgen. Carex, especially in sect. Aulocystis, sect. Digitatae, sect. Glaucae, sect. Paniceae, and sect. Siderostictae. Our data updates the current understanding of genome sizes in Carex. This will serve as the basis for understanding the phylogeny and evolution of Carex and will be especially useful for future genome studies.
The 1C-value is defined as the amount of DNA in an unreplicated gametic chromosome complement (Bennett and Leitch, 2011) and it is a key characteristic of organisms and one that is useful for studies of biodiversity, taxonomy, ecology, phylogeny, and population genetics. Recently, the importance of measuring genome size has been particularly emphasized in whole genome sequencing efforts, because the genome size of a taxon is directly related to the efficiency of its genome sequencing. Selecting a species having the smallest genome size in the target plant group can increase the depth of the sequencing result in next-generation sequencing (NGS) and in addition can minimize the computer memory required for genome assembly. As a preliminary step in genome research, a survey of the genome size of the targeted species and related taxa is essential.
The Plant DNA C-value Database (release 7.1; http://data.kew.org/cvalues/) managed by the Royal Botanic Gardens, Kew, currently contains 12,273 species comprising 10,770 angiosperms, 421 gymnosperms, 303 pteridophytes (246 ferns and fern allies and 57 lycophytes), 334 bryophytes, and 445 algae (Zonneveld et al., 2005; Leitch et al., 2019) and these numbers have grown since Bennett and Smith (1976) first published compiling lists of DNA C-values in angiosperms. The genome size of angiosperms varies enormously, with the largest genome being from Paris japonica (Franch. & Sav.) Franch. (Melanthiaceae) (152.23 pg) (Pellicer et al., 2010) while the smallest is from Genlisea margaretae Hutch. (Lentibulariaceae) (0.061 pg) (Fleischmann et al., 2014). Huge genome size variations in angiosperms are probably due to the polyploidization and the replication of transposable elements (TEs) (Grover and Wendel, 2010; Kejnovsky et al., 2012; Leitch and Leitch, 2012).
The genus Carex L. (Cyperaceae) is the largest genus in the temperate zone having approximately 2,000 species worldwide (Global Carex Group, 2015). This genus is characterized by unisexual flowers without perianth and the perigynium in pistillate flowers, which is a specialized floral organ placed outside of a carpel (Global Carex Group, 2015).
Carex is a plant group having holocentric chromosomes that might cause relatively rapid speciation (Hipp et al., 2010; Chung et al., 2012; Escudero et al., 2012). Holocentric chromosomes are characterized by a diffuse centromere that facilitates fission (agmatoploidy), fusion (symploidy), translocations, and inversion (Hipp et al., 2013). Therefore, chromosome numbers in Carex exhibit high diversity ranging from n = 6 to n = 66 (Tanaka, 1949; Hipp et al., 2009; Chung et al., 2016). To date, the genome size of Carex species has been reported for 329 accessions (292 species and infraspecific taxa; 276 species) ranging from 1C = 0.2 pg (C. brownii Tuck., C. kobomugi Ohwi, C. nubigena D. Don ex Tilloch & Taylor, and C. paxii Kük.) to 1C = 1.64 pg (C. cuspidate Bertol.) (data from the Plant DNA C-values Database; release 7.1). The number of species covered with this data corresponds to approximately 14% of reported Carex species worldwide.
In the present study, the genome sizes of 43 Carex species and infraspecific taxa distributed in the Korean peninsula were determined using flow cytometry. Although 180 Carex species and infraspecific taxa have been reported in the Korean peninsula (Park, 2007), intensive studies of their genome sizes have not yet been performed. To understand genome size variation in each subgroup of Carex, we performed a combined analysis for our data with previously reported Carex genome size data deposited in the Plant DNA C-values Database.
Material and Methods
Plant material
Forty-three species and infraspecific taxa of Korean Carex were collected in the field and transplanted in the Sungshin Women’s University, Seoul, Korea. Voucher specimens were deposited in the herbarium of the Sungshin Women's University (SWU) (Table 1). Subgeneric and sectional classification of these taxa followed Egorova (1999) and scientific names followed a recent manual for grasses and sedges in Korea (Cho et al., 2016). Plant standards for flow cytometry have been proposed in Doležel et al. (2007). We requested seeds of Raphanus sativus L. ‘Saxa’ (2C = 1.11 pg), Solanum lycopersicum L. ‘Stupické polní rané’ (2C = 1.96 pg), and Glycine max Merr. ‘Polanka’ (2C = 2.50 pg) from Dr. Jaroslav Doležel (Laboratory of Molecular Cytogenetics and Cytometry, Institute of Experimental Botany, Olomouc, Czech Republic) and used them for the analyses. Seeds were germinated and grown in the greenhouse at Sungshin Women’s University and fully grown leaves were used for flow cytometry.
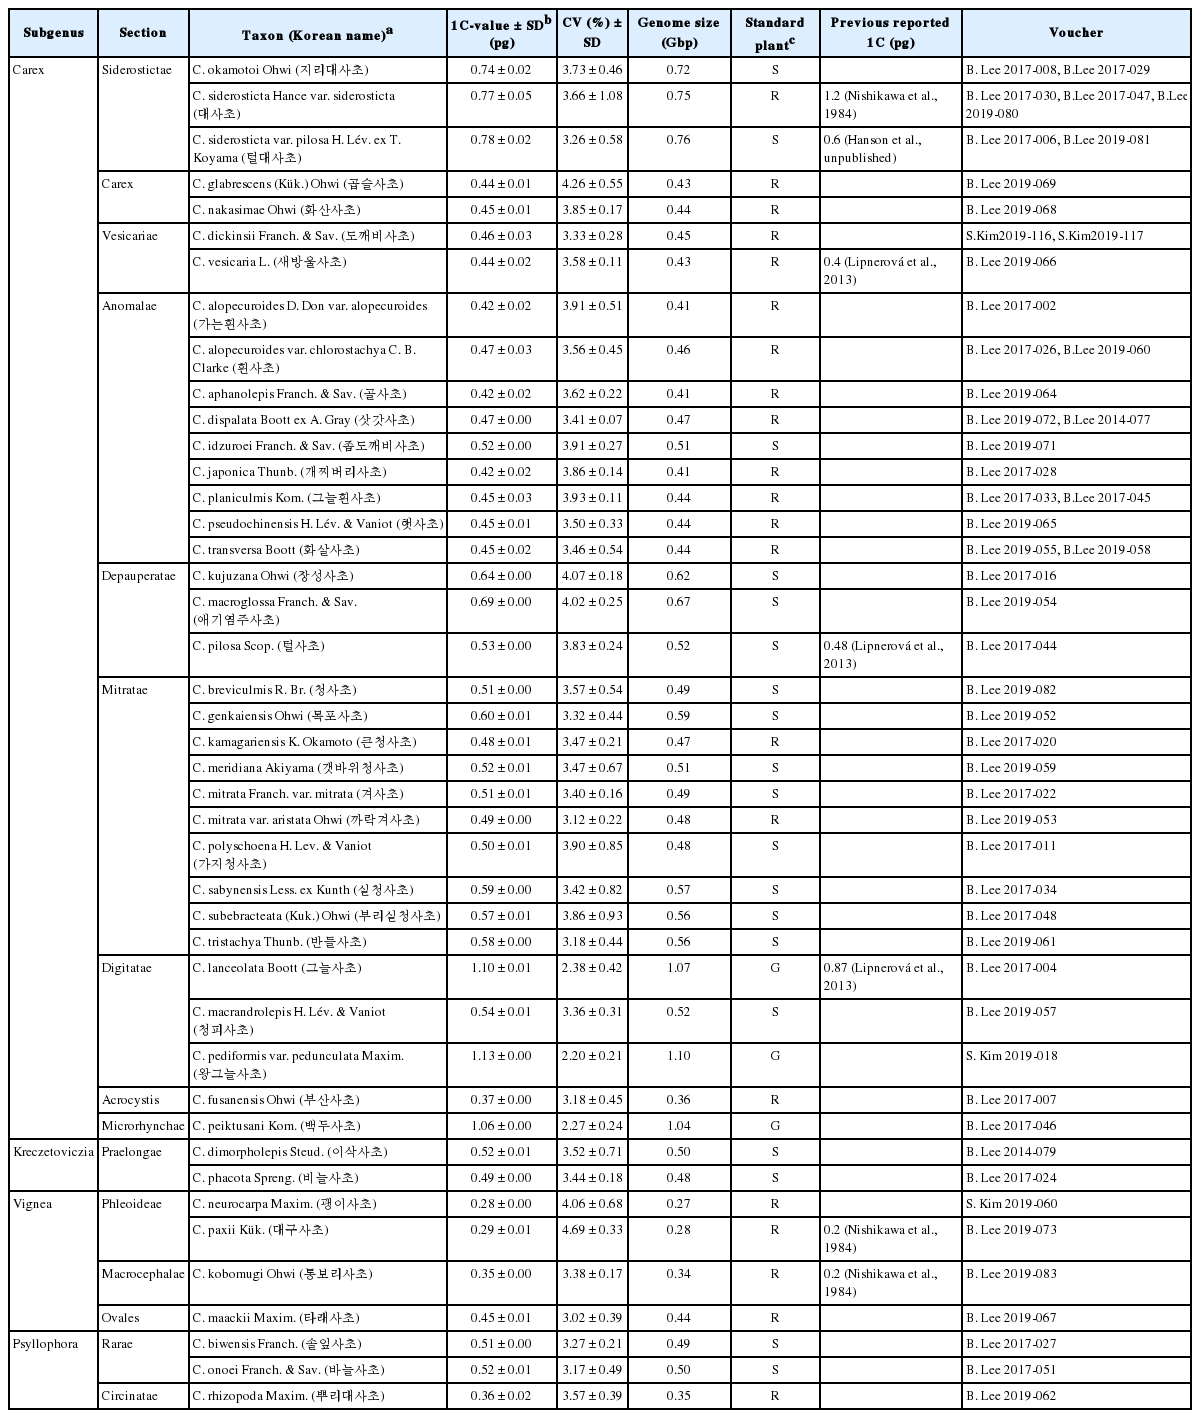
Genome size and voucher information of Korean Carex included in this study.
Sample preparation and flow cytometry
The genome size of each plant was estimated using flow cytometry as described in Doležel et al. (2007). Fresh leaves from a standard plant and a sample for estimation (each ca. 0.5 cm2) were co-chopped using a razor blade in a Petri dish with Otto I buffer (0.1 M citric acid plus 0.5% Tween 20) (Galbraith et al., 1983; Otto, 1990). The nuclear suspension was filtered through a 30 um nylon filter (CellTrics, Partec GmbH, Görlitz, Germany). The filtered suspension was added to Otto II buffer (0.4 M Na2HPO4 · 12H2O) (Doležel and Göhde, 1995) containing 50 mg/mL propidium iodide (PI; Sigma-Aldrich, Sigma-Aldrich, St. Louis, MO, USA) and 50 mg/mL RNase A (Thermo Fisher Scientific Inc., Waltham, MA, USA).
Samples were analyzed on an SH800S Cell Sorter (Sony Biotechnology Inc., San Jose, CA, USA). Each analysis was repeated at least three times on different days, except for C. dispalata, C. mitrata var. mitrata, C. pediformis var. pedunculata, C. kobomugi, and C. biwensis, which were repeated twice. At least 8,000 particles were measured in each sample, and the mean number of channels and coefficient of variation of the DNA peak (CV% = Standard deviation of the peak/mean channel number of the peak × 100) were evaluated. The final data only includes samples with a CV of less than 5% as suggested by Loureiro et al. (2007). The 2C-value was calculated based on the relative counts between G1 (growth 1 stage on the cell division) peaks from a standard plant and from a sample for the estimation. Finally, the genome size (bp) was calculated by the equation suggested in Doležel et al. (2007): 1C (pg) DNA = 0.978 × 10⁹ bp.
Statistical analysis for combined genome size data
To address genome size statistics in each subgroup in Carex, we added our new data to the previously reported genome size data deposited in the Plant DNA C-value Database. When a species has multiple accessions, we used an average value for statistical analyses to minimize data bias. The minimum, maximum, average, and standard deviations were calculated in each subgenus and section based on Egorova’s classification system in Carex (Egorova, 1999).
Results and Discussion
The flow cytometry results showed well-resolved histograms (Fig. 1) with 2C peaks from a target sample and a plant standard having 2.20–4.69% CV, which is within acceptable infraspecific variation limits suggested by Doležel and Bartos (2005). We now report for the first time, genome size data from 43 species and infraspecific taxa of Carex distributed in the Korean peninsula (Fig. 1, Table 1). Our results provide a 10.7% increase in data at the species level, against the existing genome size data for Carex (292 species and infraspecific taxa; 276 species; data from the Plant DNA C-Value Database). From our analyses of Korean Carex (Table 1), 2C-values range from 0.55 pg (C. neurocarpa Maxim.) to 2.25 pg (C. pediformis var. pedunculata Maxim.), thus making 1C-values that range from 0.28 pg (0.27 Gbp) to 1.13 pg (1.10 Gbp).

Flow cytometry histograms showing picks of size-standard plants and targeted samples (bold). More than 8,000 count events are included in each estimation. S (Solanum lycopersicum) R (Raphanus sativus), and G (Glycine max) indicate standard plants. G1 and G2 after the abbreviation of standard plants indicate peaks of G1 (2C) and G2 (4C) stages of the cell cycle. (A) C. okamotoi. (B) C. siderosticta var. siderosticta. (C) C. siderosticta var. pilosa. (D) C. glabrescens. (E) C. nakasimae. (F) C. dickinsii. (G) C. vesicaria. (H) C. alopecuroides var. alopecuroides. (I) C. alopecuroides var. chlorostachya. (J) C. aphanolepis. (K) C. dispalata. (L) C. idzuroei. (M) C. japonica. (N) C. planiculmis. (O) C. pseudochinensis. (P) C. transversa. (Q) C. kujuzana. (R) C. macroglossa. (S) C. pilosa. (T) C. breviculmis. (U) C. genkaiensis. (V) C. kamagariensis. (W) C. meridiana. (X) C. mitrata var. mitrata. (Y) C. mitrata var. aristata. (Z) C. polyschoena. (AA) C. sabynensis. (AB) C. subebracteata. (AC) C. tristachya. (AD) C. lanceolata. (AE) C. macrandrolepis. (AF) C. pediformis var. pedunculata. (AG) C. fusanensis. (AH) C. peiktusani. (AI) C. dimorpholepis. (AJ) C. phacota. (AK) C. neurocarpa. (AL) C. paxii. (AM) C. kobomugi. (AN) C. maackii. (AO) C. biwensis. (AP) C. onoei. (AQ) C. rhizopoda.
Seven taxa in our estimation overlapped with data in the Plant DNA C-values Database, and their 1C-values were slightly different (Table 1). First of all, we cannot exclude the possibility of sample misidentification. However, the major contribution to differences result from different methodologies related to measurement technique, reference standard, staining dye, chemical interference, etc. (as discussed in Lipnerová et al., 2013; Wang et al., 2016; Yan et al., 2016). C. siderosticta Hance var. siderosticta, C. siderosticta var. pilosa H. Lév. ex T. Koyama, C. paxii Kük., and C. kobomugi Ohwi were estimated by Feulgen microdensitometry in the previous estimations, while we used flow cytometry with PI (Nishikawa et al., 1984; Leitch et al., 2019). Although C. vesicaria L., C. pilosa Scop., and C. lanceolata Boott were estimated using S. lycopersicum L. ‘Stupické polní rané’ (1C = 0.87 pg), C. acutiformis Ehrh. (1C = 0.41 pg), and Oryza sativa subsp. japonica ‘Nipponbare’ (1C = 0.40 pg) as standard plants in the previous study (Lipnerová et al., 2013), we used R. sativus L. ‘Saxa’ (2C = 1.11 pg), S. lycopersicum L. ‘Stupické polní rané’ (2C = 1.96 pg), and G. max Merr. ‘Polanka’ (2C = 2.50 pg). These plant standards were calibrated using human male leukocytes (2C = 7.0 pg) which was overestimated compared to modern sequencing data (Doležel and Greilhuber, 2010; Lipnerová et al., 2013).
The Plant DNA C-Value Database with our data included, contains a total of 372 Carex accessions. We identified the taxonomic position of these accessions based on Egorova’s classification system of Carex (Egorova, 1999) and performed statistical analyses in each subgroup of the Carex. We excluded accessions showing unclear sectional membership, which left data from 248 Carex species remaining (Table 2). The final data set reveals that the average genome size of Carex is 0.47 ± 0.19 pg (1C) (Table 2). C. cuspidate Bertol. has the largest genome (1C = 1.64 pg) and four species equally (C. brownii Tuck., C. kobomugi Ohwi, C. nubigena D. Don ex Tilloch & Taylor, and C. paxii Kük.) have the smallest genome (1C = 0.20 pg). The large genomes are frequently found in the subgen. Carex compare to other subgenera (Fig. 2), especially in sect. Aulocystis, sect. Digitatae, sect. Glaucae, sect. Paniceae, and sect. Siderostictae. However, genome size variations in these sections were also relatively high. The sect. Secalinae of the subgen. Carex has the lowest mean value in the sectional level (1C = 0.25) (Table 2). Also, the mean value of subg. Vignea is relatively small (1C = 0.37) (Fig. 2, Table 2) and is consistent with the result of Lipnerová et al. (2013).
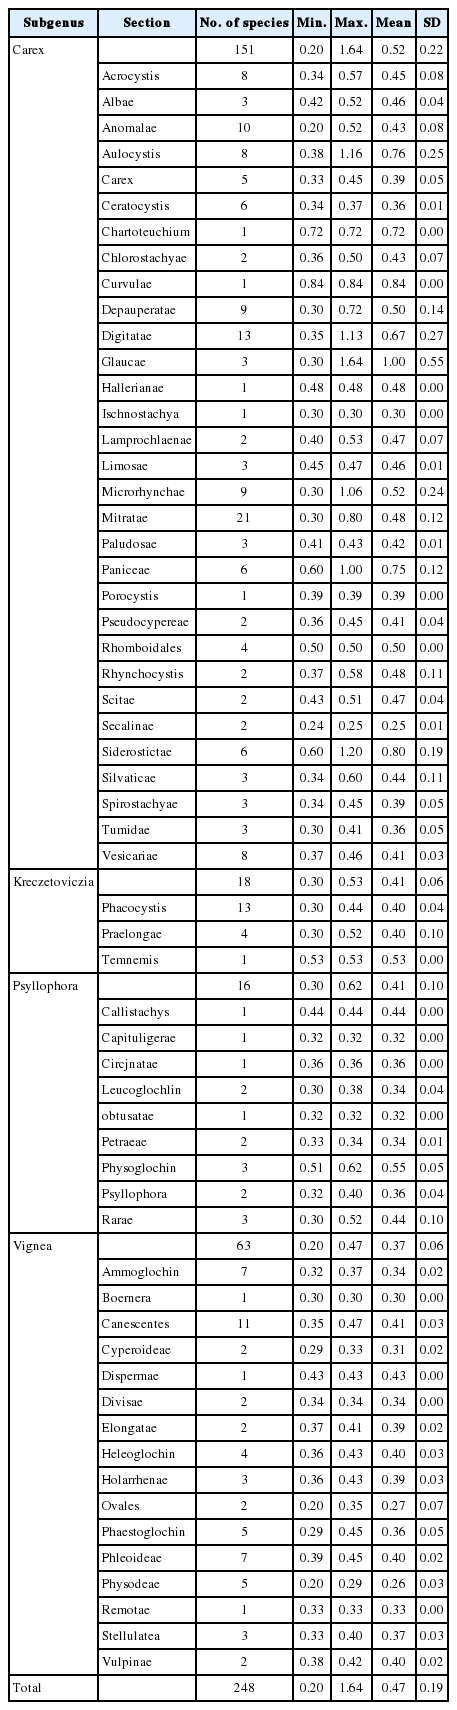
Genome size of subgroups in Carex reported to date including this study.
We provided the first intensive genome size information of Carex distributed in Korea and our data updates the overall current understanding of the genome size in Carex. This data will form the basis for understanding the phylogeny and evolution of Carex as well as genetic studies on Korean endemic species. In addition, our data will be useful information for future intensive genome sequencing projects in Carex.
Acknowledgements
This work was supported by the Sungshin University Research Grant of 2017. The authors thank Dr. Jaroslav Doležel for providing seeds of standard plants for flow cytometry.
Notes
ORCID: Bora LEE https://orcid.org/0000-0002-2561-1823; Yanghoon CHO https://orcid.org/0000-0001-8942-3330; Sangtae KIM https://orcid.org/0000-0002-1821-4707
Conflict of Interest
The authors declare that there are no conflicts of interest.