한반도 해안식물 10종의 분포 변화 추정
Estimating distribution changes of ten coastal plant species on the Korean Peninsula
Article information

Abstract
염습지 개발과 기후온난화로 인해 해안지역의 생물 서식환경이 변화하고 있다. 환경변화로 인한 한반도 해안식물들의 미래분포변화를 추정하기 위해 MaxEnt 프로그램을 이용하여 해안식물 10종의 예상분포지를 분석하였다. 연구지역은 한반도 동·서·남해안 지역을 대상으로 하였다. 예상분포지 추정은 해안식물의 동아시아 지역 분포자료와 WorldClim 2.0의 19개 기후변수를 사용하였다. 3개의 대기대순환모델(general circulation model; CCSM4, MIROC-ESM 그리고 MPI-ESM-LR)과 4가지 온실가스시나리오(representative concentration pathways; 2.5, 4.5, 6.0 그리고 8.5), 그리고 2개 기간(2050와 2070)이 반영된 미래 기후변수로 미래 예상분포지를 예측하였다. 분석결과 연평균 기온이 적정 분포지 추정에 가장 높은 기여를 하였다. 미래에 분포가 감소할 것으로 예상되는 분류군은 갯메꽃, 갯방풍, 갯씀바귀, 갯완두, 해란초, 참골무꽃, 순비기나무였으며, 분포가 증가할 것으로 예상되는 분류군은 갯사상자로 나타났다. 미래 분포가 현재와 비슷할 것으로 생각되는 분류군은 수송나물, 통보리사초였다. 각 식물의 미래 예상분포지를 종합하여 분포평균을 계산한 결과 서해와 남해가 동해보다 기후변화의 영향을 크게 받을 것으로 예상된다. 이 결과는 해안식물의 보전전략을 수립하는데 기초자료로 활용될 것이다.
Trans Abstract
Coastal regions are experiencing habitat changes due to coastal development and global warming. To estimate the future distribution of coastal plants on the Korean Peninsula due to climate change, the potential distribution of ten species of coastal plants was analyzed using the MaxEnt program. The study covered the eastern, western, and southern coastal areas of the Korean Peninsula. We used the distributional data of coastal plants of the East Asian region and the 19 climate variables of WorldClim 2.0. The future potential distribution was estimated using future climate variables projected from three general circulation models (CCSM4, MIROC-ESM, and MPI-ESM-LR), four representative concentration pathways (2.5, 4.5, 6.0, and 8.5), and two time periods (2050 and 2070). The annual mean temperature influenced the estimation of the potential distribution the most. Under predicted future distribution scenarios, Lathyrus japonicus, Glehnia littoralis, Calystegia soldanella, Vitex rotundifolia, Scutellaria strigillosa, Linaria japonica, and Ixeris repens are expected to show contracted distributions, whereas the distribution of Cnidium japonicum is expected to expand. Two species, Salsola komarovii and Carex kobomugi, are predicted to show similar distributions in the future compared to those in the present. The average potential distribution in the future suggests that the effects of climate change will be greater in the west and the south coastal regions than in the east coastal region. These results will be useful baseline data to establish a conservation strategy for coastal plants.
Coastal regions are ecologically and economically important places and provide a wide range of ecological habitats with high net ecosystem productivity (Costanza et al., 1997; Martínez et al., 2007). The wide range of geomorphological features and weather types of extensive coastal regions enable habitats for a large variety of biomes to exist (Bird, 2000). Coastal regions are preferred areas not only for human habitation but also for activities such as tourism, leisure, and recreation (Post and Lundin, 1996). Coastal regions harboring diverse ecosystems are facing changes resulting from climate change and anthropogenic factors. Human population growth in coastal regions is expected to continue in the future (Small and Nicholls, 2003; Hugo, 2011). Urbanization is accompanied by population growth, which causes local and regional environmental changes that result in changes to land cover and use, hydrological systems, and biodiversity (Grimm et al., 2008). Meanwhile, the Intergovernmental Panel on Climate Change (IPCC) (2014) assessment report shows that the global climate has been influenced by anthropogenic effects, and the impacts of global warming over the last few decades in the atmosphere and ocean are obvious. Climate change will extensively affect not only inland regions but also coastal regions, especially with polar ice caps diminishing and sea levels rising.
Climatic change will affect the habitats of species in coastal regions. The global impact of climate change could influence a wide range of species (IPCC, 2014). Species adapted to the environment in their own range will have to move to more suitable places to survive, as the environment changes continue, and will be affected by the climate changes (Root et al., 2003; Bellard et al., 2012; IPCC, 2014). In coastal regions, however, a suitable habitat for species is also diminishing because of anthropogenic development for various land uses and urbanization resulting from increasing human population. Plants will be more affected by climate change because they have less mobility, including dispersal ability, than animals. Along with climate change, these anthropogenic pressures will have a secondary impact (Anthony et al., 2009; Abel et al., 2011). Estimating the impact of climate change on coastal species is important for the conservation efforts of coastal ecosystems.
The geographic distribution of species is affected by various environmental factors. In the past few decades, abundant georeferenced environmental variable maps have been produced based on the Geographic Information System (GIS) (Vega et al., 2018) and digitized species occurrence data (e.g., GBIF.org, 2019). This allows us to estimate distributions of species by using species distribution modeling (SDM). By estimating the geographic range of species through SDM, the potential influence of climate change on species ranges can be assessed (Schwartz et al., 2006; Rodríguez et al., 2007; Peterson, 2011). Although SDM has limitations when considering microenvironments, geographical barriers, dispersal character of the species, and competition between/among species, it has much potential for being applied to a wide range of biological fields, including conservation (Rodríguez et al., 2007; Pearson, 2010). There are several studies from Korea providing a conservation perspective and predicting distribution changes of naturalized plants in response to climate change using the SDM approach (e.g., Sung et al., 2018; Lee et al., 2013; Lee et al., 2016a; Shin et al., 2018). However, no study focusing on the coastal region in Korea has been conducted to date.
On the Korean Peninsula, coastal areas have long coastlines, covering a wide area with various geomorphological features. The coastline of the Korean Peninsula, connecting the east coast through the south coast from the west coast, is approximately 17,000 km long, and the west, south, and east coasts have different environmental characters (Shim et al., 2017). The west coast has a complex coastline with a wide range of topographies including tidelands, sandy beaches, sand dunes, sea cliffs, and wave-cut shelves. Tidelands of the west coast, including salt marshes and swamps, extend over a wide area. The south coast has intermediate characteristics of both the west and east coasts and consists of a complicated coastline with more rias than the west coast. The western part of the south coast is highly influenced by tidal action, but the eastern parts are more affected by wave action. The east coast has a monotonous coastline and well-developed sand beaches affected by longshore currents. The coastal region of the Korean Peninsula has been transformed through a range of reclamation projects (Choi, 2014; Koh and Khim, 2014), and the coastline in the Republic of Korea as a whole has been shortened by approximately 1,900 km since the 1910s (Choi et al., 2009). The coastal region in the Korean Peninsula is facing anthropogenic and climate change impacts affecting the species in that region.
In the present study, we examined the distribution of 10 coastal plants that occur throughout the Korean Peninsula. We aimed to (1) estimate the current distribution of the plants in the coastal region of the Korean Peninsula using SDM, (2) assess predicted changes in the distribution of these coastal plants under predicted climate change scenarios through estimated distribution modeling of each species, and (3) add valuable insight into the conservation strategy for the coastal region based on the predicted impacts of climate changes.
Materials and Methods
Species occurrence data
We selected 10 species to study the potential distributional changes of coastal plants in Korea (Table 1). We excluded species occurring inland or having a narrow distribution (e.g., species only distributed in Jeju Island). Only one species was selected per family to avoid repeated biological characters. Ten coastal plants including four endemic species of East Asia were selected for this study. Species occurrence data was collected from Shim et al. (2009, 2017), Park et al. (2009), Oh and Kim (2008) and from the GBIF data (http://www.gbif.org) by using the ‘gbif’ command of the ‘dismo’ package in the R program (Hijmans, 2017). We selected 1,548 occurrence data points in East Asia for distribution modeling. Among the species selected, five species have a global distribution, and the others have a limited distribution in East Asia (i.e., Korea, Japan, China, and Far East Russia).
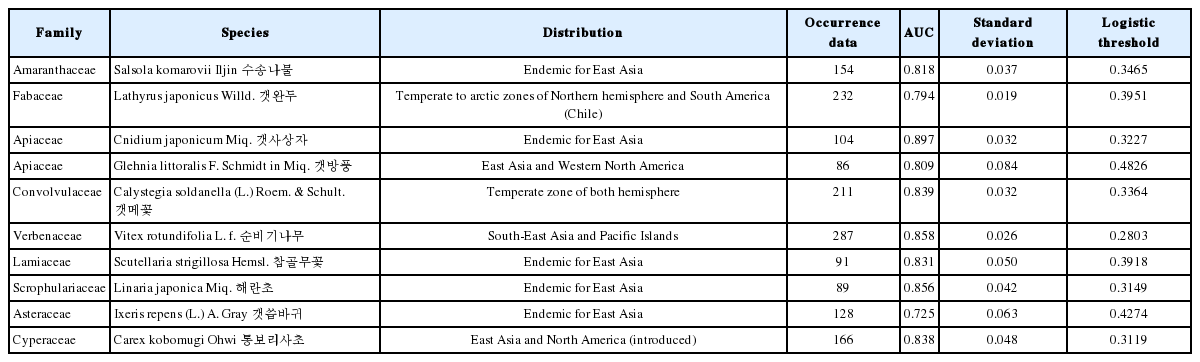
The coastal species selected for species distribution modeling.
Environmental variables
We only used climate variables to model potential distributions of coastal plant species. Climate variables were obtained from WorldClim 2.0 (current) and 1.4 (future). We selected 19 bioclimate variables with a 30 arc second resolution (ca. 1 km2 in the temperate zone), derived from temperature and precipitation raster data interpolated using a thin-plate smoothing spline algorithm (Hijmans et al., 2005; Fick and Hijmans, 2017). We used future climate variables in three general circulation models (GCMs), namely, CCSM4 (Gent et al., 2011), MIROC-ESM (Watanabe et al., 2011), and MPI-ESM-LR (https://portal.enes.org/models/earthsystem-models/mpi-m/mpi-esm). These were projected as greenhouse gas scenarios with three or four representative concentration pathways (RCPs; 2.5, 4.5, 6.0, and 8.5) of two time periods (2050: average for 2041–2060 and 2070: average for 2061– 2080). To model distributions of coastal plants inhabiting the shoreline of Korea, climate variables in a 5 km coastal buffer were extracted using ArcGIS 10.5 (ERSI, Redlands, CA, USA) following the method of Mendoza-González et al. (2013).
Model selection
We used MaxEnt 3.4.1 with 1,548 occurrence data points of the 10 coastal plant species to develop the models of species distributions (Phillips and Dudík, 2008). In order to develop reasonable distribution models for coastal plants, we developed a distribution model for each species in a wider area (21°–55°N, 112°–146° E, extending from Taiwan to Sakhalin Island through the Korean Peninsula and the Japan Archipelago, including almost the entire distributions in East Asia of the selected coastal plants) and projected this using both current and future climate variables of the Korean Peninsula. To avoid overfitting issues and multicollinearity problems in the SDM, relevant climate variables for each species were selected according to following process. We selected one of the climate variables sharing a high Spearman correlation efficient (>0.9) by using SDMtoolbox 2.4 (Brown et al., 2017). For the remaining climate variables, climate data corresponding to the occurrences of each one of the species were extracted and used for a principal component analysis (PCA) to exclude relatively more subservient climate variables. The PCA analyses were conducted in the R program with ‘raster’ packages (Hijmans, 2020). The selected climate variables of each species (a range of seven to nine variables) were used to develop a model of species distribution in the MaxEnt program. MaxEnt runs were performed in batch mode and were set with response curves, jackknife, replicates 10, logistic output, random seed, background point 10,000, and iteration 1,000 parameters. The rest setting was used as the default. Finally, the developed models in the broader area for each species were projected to current and future climate variables of three GCMs with three or four RCPs in the Korean Peninsula. Although the models contained extrapolated data, the distribution model was less affected as it was developed in the wider area of East Asia rather than just the study region of the Korean Peninsula.
Analysis of potential future distributions
We compared the current potential distribution of each species with those predicted in the future. We converted the logistic output of the MaxEnt model, which is a continuous value between 0 and 1, into a binary format to facilitate a comparison of the differences among the periods and the four RCPs. Following Bystriakova et al. (2014), we use maximized training sensitivity and specificity values (MTSS), which were averaged from 10 replicated models, as a threshold value to convert into the binary format with presence or absence points. Each potential distribution point resulting from climate variables of the three GCMs were averaged by the same periods and RCPs. Potential distribution areas of each species were compared using the number of presence cells in binary format. For comparison by RCP scenarios, binary potential distributions in the Korean Peninsula of all species were averaged by each RCP scenario using the method developed for species richness climate change studies in South Korea (Shin et al., 2018).
Results
Distribution models
Current and future potential distributions of 10 coastal plants in the Korean Peninsula were obtained by projections from distribution models of each species in East Asia developed by SDM with 1,548 occurrence data points. In the models for East Asia, the area under the curve presenting accuracy of distribution models were 0.725–0.897 (Table 1). The highest and lowest AUCs were calculated for Cnidium japonicum Miq. and Ixeris repens (L.) A. Gray, respectively. Nine of the 12 climate variables were used to develop the models in East Asia, namely Bio_1 (annual mean temperature), Bio_2 (mean diurnal range), Bio_3 (Isothermality), Bio_4 (temperature seasonality), Bio_8 (mean temperature of wettest quarter), Bio_12 (annual precipitation), Bio_13 (precipitation of wettest month), Bio_14 (precipitation of driest month), and Bio_15 (precipitation seasonality) (Table 2). Eight of those variables were used in the distribution models of Scutellaria strigillosa Hemsl. and Linaria japonica Miq.; the distribution models of the remaining species were developed using seven variables (Table 2). Among those, Bio_1 was the variable highest in both percent contribution (PC) and permutation importance (PI) of all species distribution models (Table 2). Bio_12 had the second highest PC and Bio_15 had the second highest PI.

Analysis of contribution resulted in a 10-fold cross-validation MaxEnt model for the 10 species.
Potential plant species distribution in the Korean Peninsula
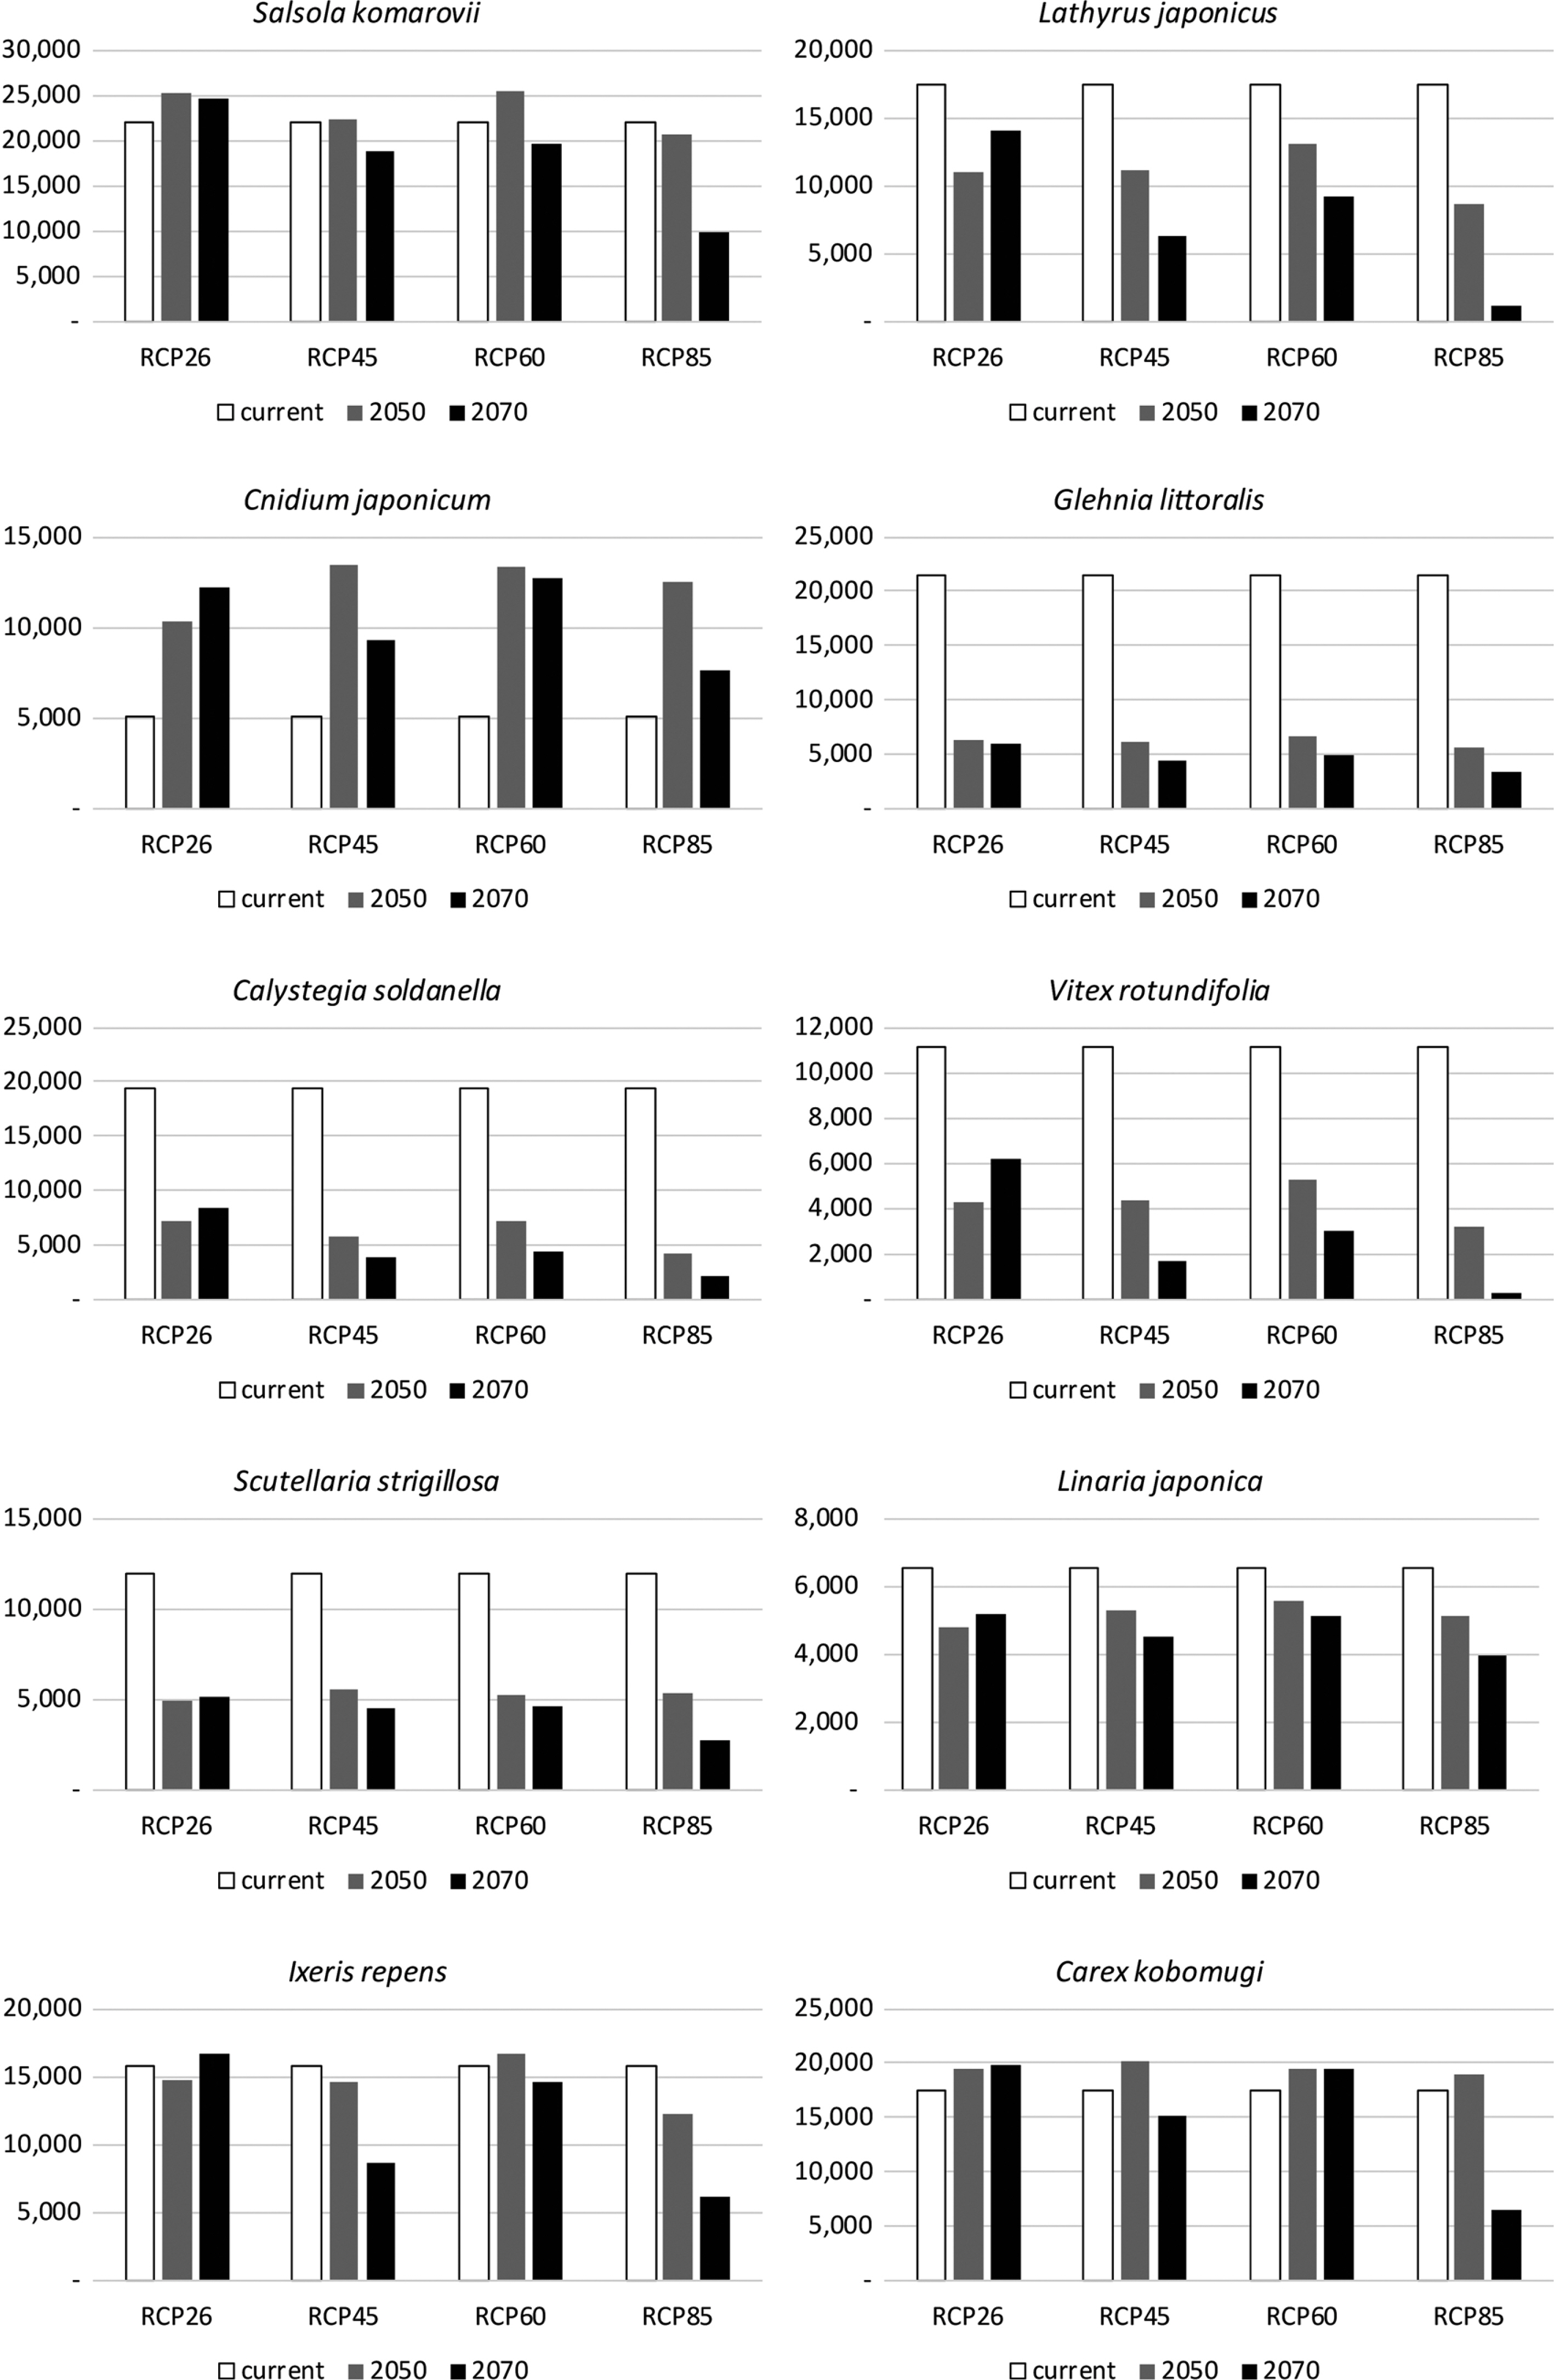
Potential distributions of 10 coastal plants in the Korean Peninsula, which were projected from distribution models in East Asia and converted to binary format by using the MTSS threshold, were compared with those among two time periods and four RCPs (Fig. 1). The species with over 10% reduction in the potential distribution area in the future were Calystegia soldanella, Glehnia littoralis, I. repens, Lathyrus japonicus, Linaria japonica, Scutellaria strigillosa, and Vitex rotundifolia. The reduction percentages of those species ranged from 74.9% (G. littoralis) to 17.4% (I. repens) and the average reduction percentage was 52%. Cnidium japonicum only showed an average increased potential distribution in the future was 126.1% (Fig. 2). Two species, Carex kobomugi and Salsola komarovii, showed only a 6% and 1% lower average future distribution than current distributions, respectively (Fig. 2). Changes of the potential distributions from 2050 to 2070 showed an increase in RCP26 but a reduction in all other scenarios. A comparison between the 2050 and 2070 periods revealed that the differences in the potential distributions of all species reduced over time (Fig. 2). We found that the potential distribution of the species with a decreased potential distribution in the future mostly showed reductions in the west and the south coasts (Fig. 1). The future potential distribution of C. japonicum increased in the west and south coasts and extended further toward the northern side. Except for three species (Cnidium japonicum, Scutellaria strigillosa, and I. repens), the future potential distributions of most species in the north-eastern coast increased (Fig. 1). Aside from Cnidium japonicum and Carex kobomugi, the future potential distributions of species in the southern half of the Korean Peninsula decreased in all time periods and scenarios (Fig. 1). We found that the averaged potential distributions by periods and RCPs were higher in the east coast than in the west and south coasts and that the northern sections of the east coast showed higher values than the southern sections of the east coast. A negative difference between current and future potential distribution was found in the west and the south coasts and a positive difference was found in the north-east coast (Fig. 3).
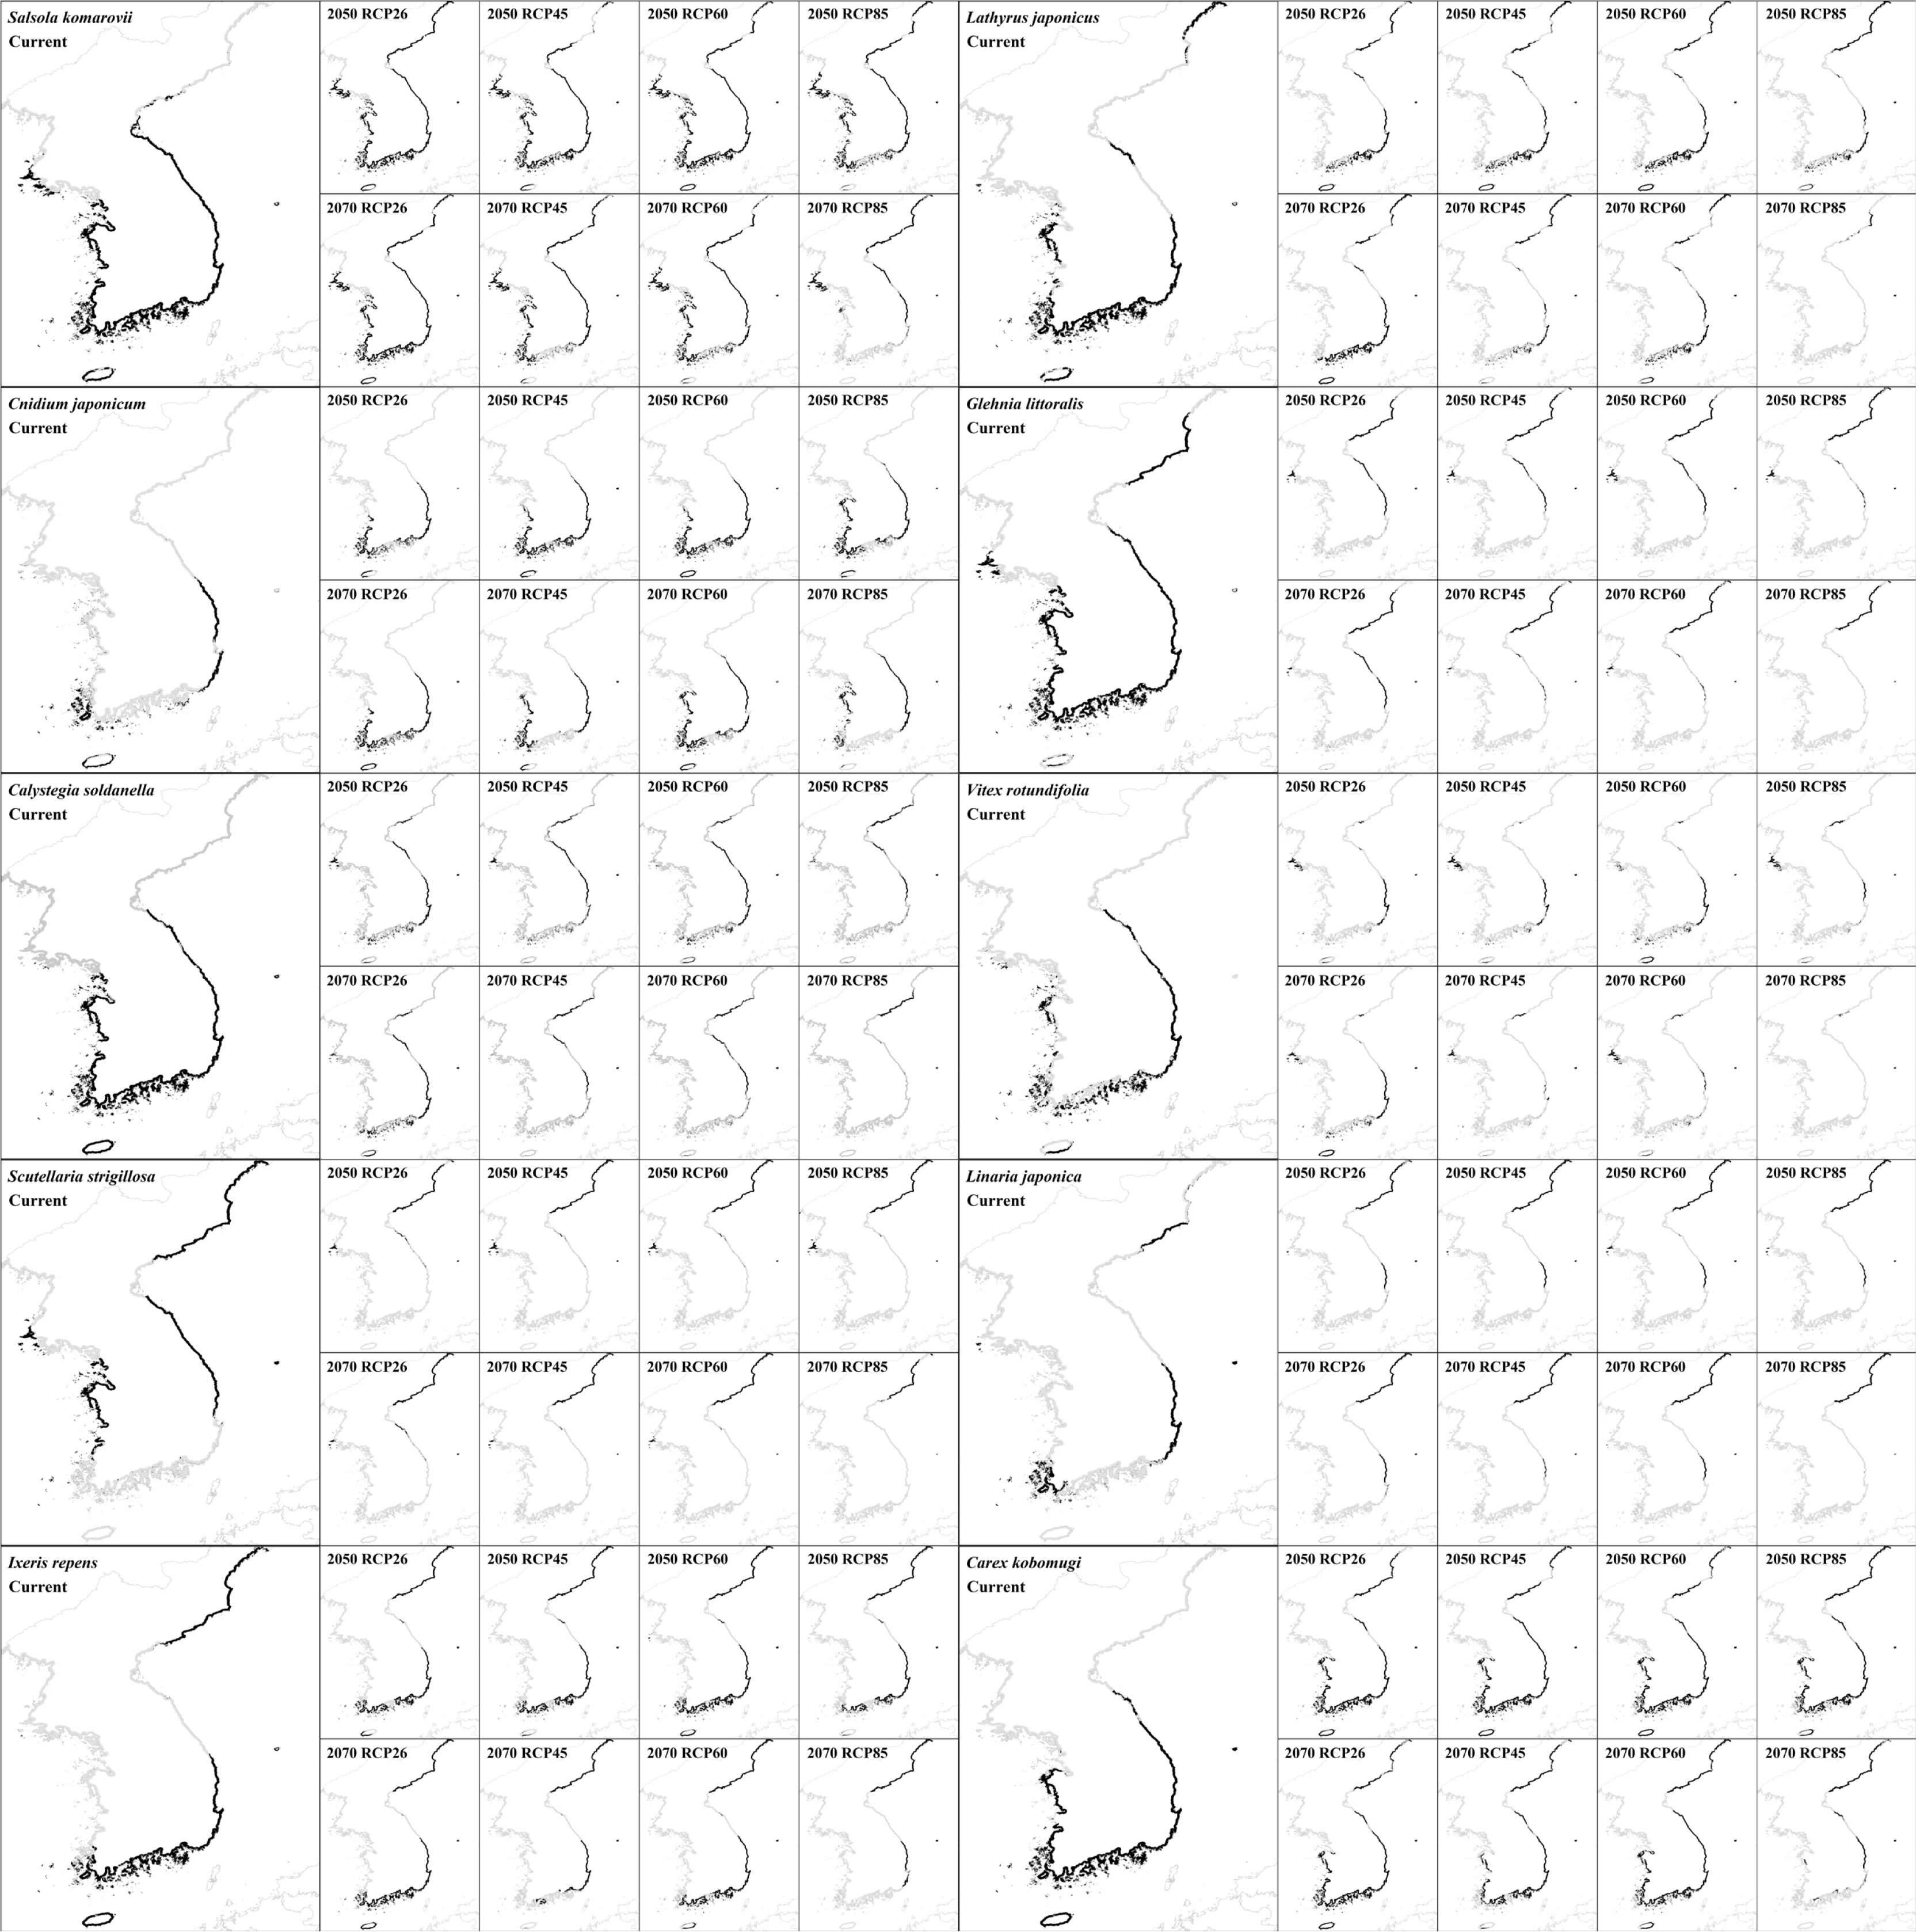
Current potential distributions of 10 coastal plants in the Korean Peninsula and future potential distributions of each species by four representative concentration pathway (RCP) scenarios. Distribution maps of binary format with presence or absence were created using maximized training sensitivity and specificity values as a threshold.
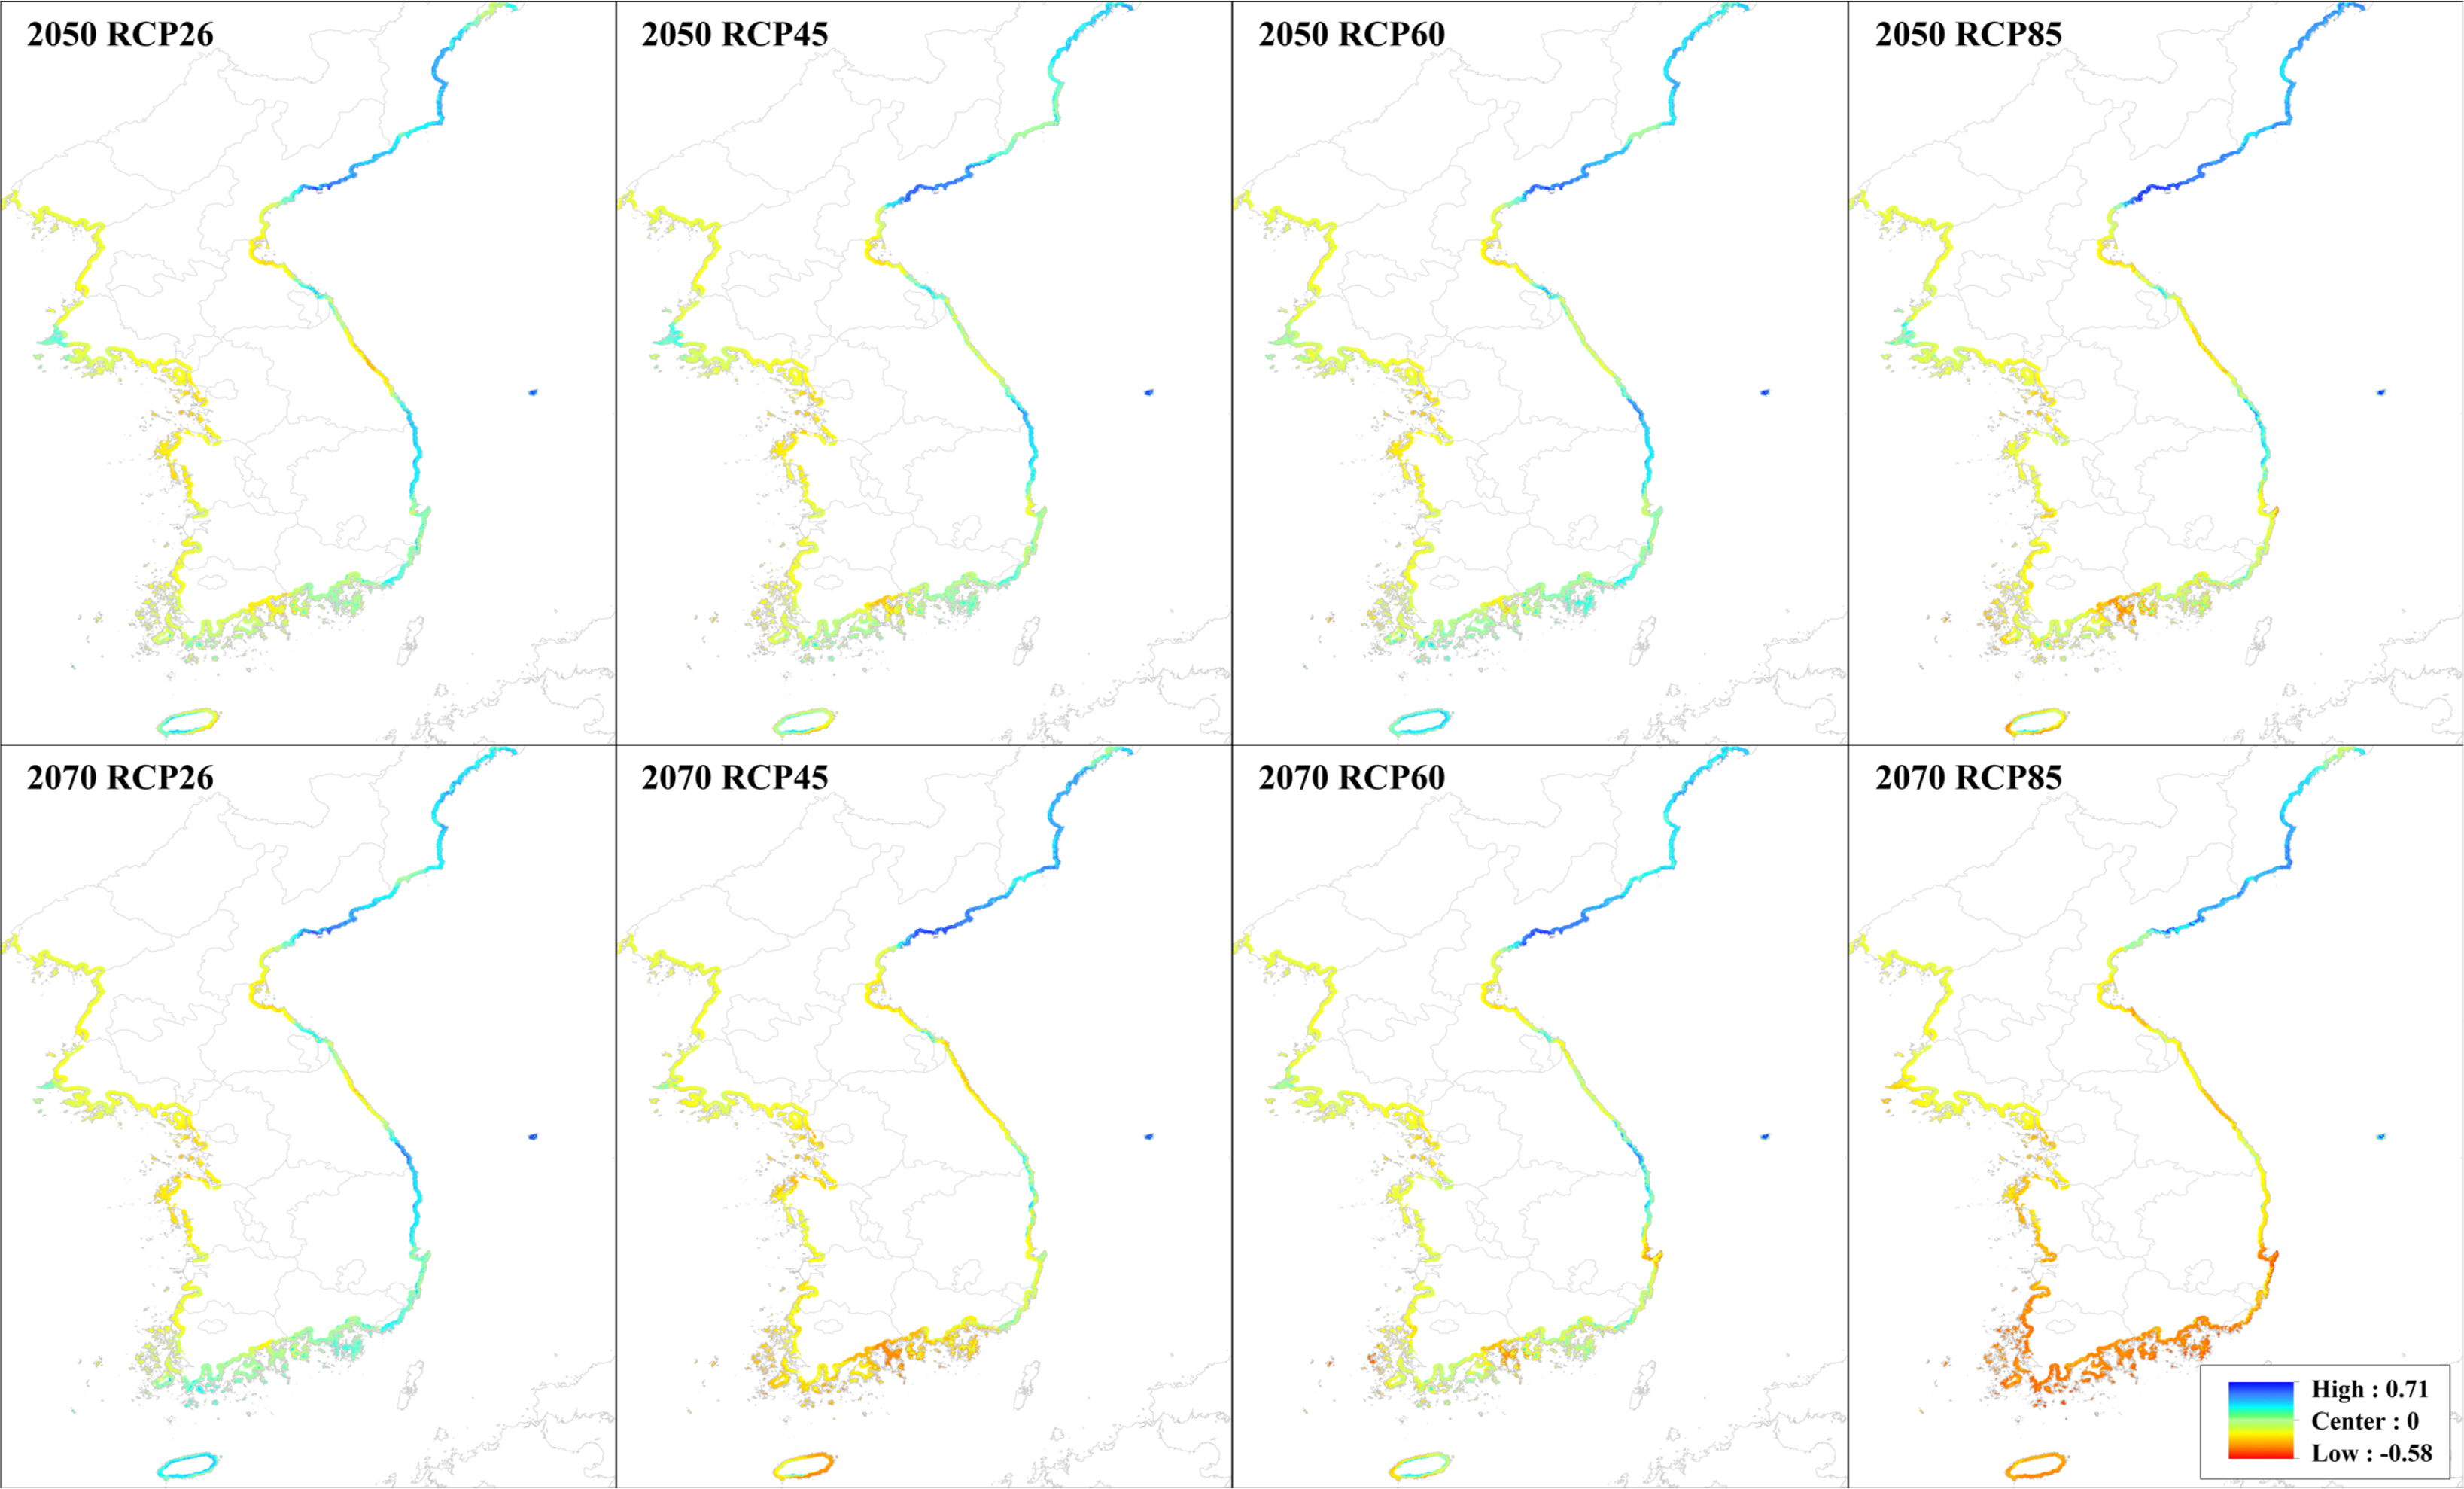
Difference between current and future averaged distribution area of 10 coastal plants by three periods and four representative concentration pathway (RCP) scenarios. These were averaged distribution models developed from three general circulation models.
Discussion
The potential distributions of 10 coastal plants in Korean Peninsula were analyzed using climate variables in the MaxEnt program. In order to develop a precise potential distribution model for each species, we utilized climate variables and species occurrence data across the broader East Asia region and projected it onto the Korean Peninsula. We used the potential distribution analyzed from coastal environments in the Korean Peninsula to predict future habitat availability for each species. The potential distributions in the future decreased in all species except C. japonicum (Figs. 1, 2). Five species (Calystegia soldanella, G. littoralis, Lathyrus japonicus, Scutellaria strigillosa, and V. rotundifolia) were especially negatively affected in future climate change scenarios, losing almost half of their distribution, ranging from 46.7% to 74.9%. The area where those species lost most of their range was under 37.5°N. In the other study of future potential distribution for endemic coastal dune plants, species showed nearly 80–100% distribution loss under the extreme case scenario (Mendoza-González et al., 2013). Although we used distribution models in the default setting with an extrapolation and clumping option, there was considerable impact suggested by SDM for potential future species distributions from climate change scenarios.
The tendency of a potential distribution shift toward the north parts along the east coast appeared in the future potential distribution of most species, as predicted by other studies (Figs. 1, 3) (Lee et al., 2013; Lee et al., 2016b; Shin et al., 2018). Our SDMs did not consider seed dispersal abilities and migration rates of each species, but six of the coastal plants in this study (Carex kobomugi, Calystegia soldanella, G. littoralis, I. repens, Lathyrus japonicus, and V. rotundifolia) are likely dispersed by ocean currents (Sawada and Tsuda, 2005). Ocean current-mediated dispersal could facilitate a range shift of each species in a transition of optimum habitat resulting from climate change. Meta-analyses for many species including plants and animals suggest average shifts of 6.4 km per a decade towards the poles in global warming scenarios (Parmesan and Yohe, 2003). However, Shin et al. (2018) showed that both endemic and northern species disappeared while southern species proceeded northward in a study estimating potential species richness in future climate change scenarios using 89 species in the Korean Peninsula (Oh et al., 2010), which included both native northern and southern species. That study suggested that most endemic and northern species would be reduced at the Southern Korean Peninsula and that the southern species could transit northwards in future. In that study, a dramatic decrease of species richness was linked to limited dispersal ability.
In the present study, the potential future distribution showed different patterns between the west and the east coast. In most species, except for Salsola komarovii and Cnidium japonicum, potential distribution does not extend along the west coast towards the north (Fig. 1). After reviewing the environmental variables, this tendency could be caused by a difference between current and future climatic variables. Annual mean temperature (Bio_01) and annual precipitation (Bio_12) were two prominent climatic variables used in developing the distribution model. The difference between current and future annual precipitation is relatively uniform in the Korean Peninsula, although there is a particularly large predicted increase in the coast near Wonsan (39.15°N, 27.5°E) of the north region compared to other regions. Annual mean temperature, however, showed a different pattern to that of annual precipitation among the regions in the Korean Peninsula. In future, the west coast will experience a larger increase of annual mean temperature than the east coast, and will be particularly higher in the area around 35°N, 37.5°N, and 39.5°N. Several SDM studies for plants in the Korean Peninsula reported that annual mean temperature or other variables related to temperature, are more influential in changes in species distributions (Lee et al., 2016a; Lee et al., 2016b; Lee et al., 2017; Sung et al., 2018). Vegetation is known to be correlated with temperature-related climatic conditions (Woodward and Williams, 1987; Woodward et al., 2004). On the other hand, a study on endemic coastal species in Mexico found that the most influential climatic variable influencing species distribution changes in that study was annual precipitation (Mendoza-González et al., 2013).
An averaged future potential distribution was calculated from the 10 species studied. It showed a pattern biased toward the east coast, and the more severe the scenario of RCP became, the more the potential distribution in the southern region on the Korean Peninsula decreased (Fig. 3). In all scenarios and periods, the east coast showed higher values than both the west and the south coast. The averaged potential distribution predicted for 2070 partially increased in the south coast in RCP26 compared to that predicted for 2050. In the remaining RCP scenario, the averaged value of the west and the south coasts decreased from 2050 to 2070. The averaged value decrease in the east coast is marginal in the northern region but is considerable in the southern region. The results from the averaged potential distribution suggests that the west and the south coasts might be more vulnerable to climate change than the east coast. These results will help when considering the establishment of conservation strategies or development plans. When establishing coastal conservation strategies in the future, information on the occurrence and distribution of coastal species will assist in setting priorities. This information might also be used to make development plans that have less of an impact on coastal plants.
The influence of sea level rise resulting from global warming was not considered in this study. Nevertheless, sea level rise could affect a change of habitat in the coastal region which is explained by the term ‘coastal squeeze’ (Doody, 2013; Pontee, 2013). Coastal squeeze is the process of coastal habitat loss as landward habitat shifts, caused by rising sea level or other factors, are blocked by artificial coastal margins. Coastal squeeze could influence plant habitats of the coastal region in the Korean Peninsula. Sea level rise in the Korean Peninsula was reported by several studies using data of the Korea Hydrographic and Oceanographic Administration (KHOA) and TOPEX/Poseidon (Kang, 2005; Yoon and Kim, 2012; Jung, 2014). Sea level in the Korean Peninsula is predicted to rise 37.5–65.0 cm under the RCPs scenarios (Heo et al., 2018). Artificial structures as part of a reclamation process have also been built up in the Korean Peninsula, particularly in the west coast (Choi, 2014; Koh and Khim, 2014). These processes of coastal habitat losses would make habitat in the coastal region more vulnerable and they might emerge more prominently in the west coast.
Methodological limitation of SDM
The SDMs we used for 10 coastal plants were developed by using only climate variables of three GCMs and four RCPs. All SDMs involve some uncertainty resulting from variation in distribution model algorithms, climate models, and available climatic data (Barry and Elith, 2006; Wiens et al., 2009; Wang et al., 2012; Koo et al., 2017). The prediction of a SDM is influenced by parameters which the distribution model algorithm depends on (Warren and Seifert, 2011; Merow et al., 2013). SDMs also cannot project microhabitats, dispersal ability of species, and biotic interaction (Wiens et al., 2009; Sinclair et al., 2010).
Nevertheless, SDM is likely to be useful for the assessment of biodiversity, designation of protection areas, prediction of invasive species, and policy decision making for conservation in Korea (Sinclair et al., 2010; Kwon et al., 2012; Lee et al., 2016a; Koo et al., 2017; Shin et al., 2018). Though SDM has uncertainty challenges, it is a useful tool for providing insight into the unpredictable impact of future climate change. The accumulation of more climatic, geological, and biotic/abiotic data will facilitate more accurate SDM development.
Conclusion
This study estimated future potential distribution of 10 coastal plants in the Korean Peninsula by using East Asian climatic data with three GCMs and four RCPs. This estimation focused on distributional shifts resulting from future climate change in order to provide useful information for a conservation strategy of the coastal region. In most of the plants assessed in this study, future potential distribution decreased, except for Cnidium japonicum. The most influential climatic variable in developing SDM was Bio_01 (annual mean temperature), followed by Bio_12 (annual precipitation). Averaged SDM of each plant and RCP shows a tendency of a northward distributional shift along the east coast. In total averaged SDM from 10 plants of each RCP, future potential distribution in the east coast increased while those in the west and the south coasts were reduced, suggesting that the west and the south coasts are more vulnerable regions against future climate change.
Although these SDMs were developed using wider east Asian climate data rather than just the Korean Peninsula, it has the limitation of being based on only climate data. Further study considering the characteristics of soil, geology, and topology should be carried out to strengthen SDM models. Our study provides useful information for a better understanding of coastal plants habitat in future climate change scenarios.
Acknowledgements
We are thankful to S.H. Lee for advice of MaxEnt program. We are also grateful to our colleagues D.P. Jin, J.W. Park, and Y.J. Jang at the Plant Systematics Laboratory of Inha University for assistance in discussing the manuscript. This work was supported by the National Research Foundation of Korea (NRF) (No. NRF --- 2018R1D1A1B07043030).
Notes
Conflict of Interest
The authors declare that there are no conflicts of interest.